Where does our data come from?
LuxPricer combines different data sources to give you the most complete picture of the market:
Market Overview & Detailed Analysis
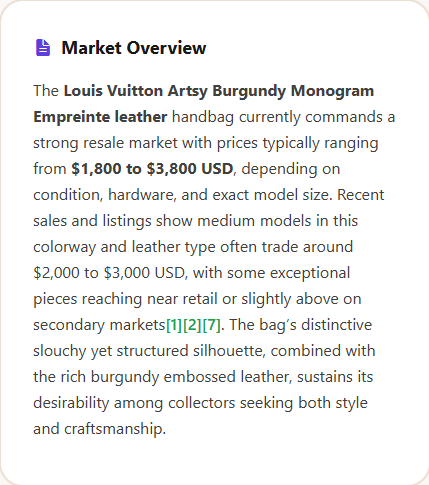
The market overview and detailed analysis sections are generated by AI that searches the internet in real-time. This gives you current market trends, recent sales, and general pricing insights.
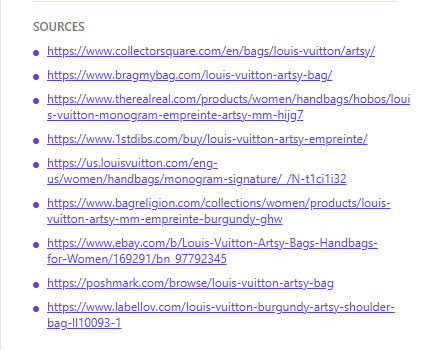
Finding the sources: You can click directly on any source mentioned in the AI output, or scroll to the “Sources” section at the bottom of your report to see where the information came from.
Estimated Price Range Box
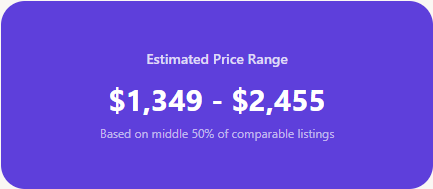
You might notice that the estimated price range box shows different numbers than what the AI analysis suggests. This is completely normal and here’s why:
The estimated price range is calculated from actual live listings that are currently for sale on resale websites right now. We collect all the comparable bags we can find, then take the middle 50% of those prices. This means we’re automatically removing the extreme highs and lows.
Why do we remove extremes? Because on resale websites, individuals sometimes list items at unusual prices by mistake or due to misinformation. By focusing on the middle 50%, we show you what most sellers are actually asking for similar bags.
Our recommendation: Use both the AI analysis and the estimated price range together. The AI gives you market context, while the price range shows you what similar bags are listed for right now. Together, they help you make the best pricing decision.
Understanding the Price Charts
First Chart: Price Distribution
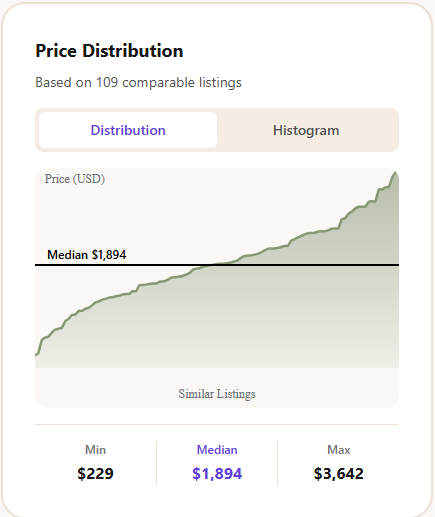
This chart shows you every comparable listing we found:
- Bottom (X-axis): Each individual listing
- Side (Y-axis): The price of each listing
- Horizontal line: The median price (the most typical price you’ll see)
What is the median? Think of it as the “most typical” price. If you lined up all the prices from lowest to highest, the median would be right in the middle. It’s different from an average because it’s not affected by extreme prices.
How to read this chart:
- If all the points are bunched together near the median line, most sellers agree on the price range
- If points are spread out far above and below the line, there’s a lot of price variation in the market
- Points far above the median might be overpriced; points far below might be underpriced or have condition issues
Second Chart: Price Histogram
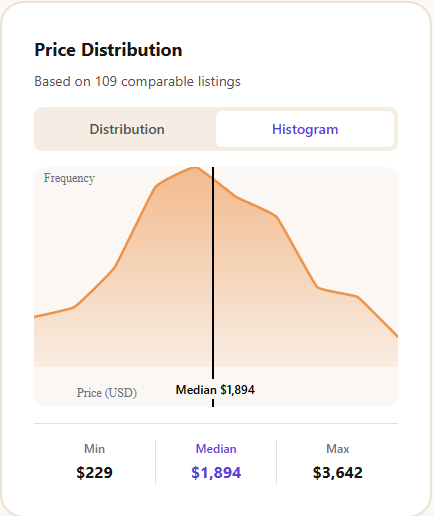
This chart shows how often each price appears:
- Bottom (X-axis): The price
- Side (Y-axis): How many listings have that price (frequency)
- Vertical line: The median price (since price is now on the bottom axis)
How to read this chart:
- If you see one tall peak near the median, most bags are priced around the same amount (strong market consensus)
- If you see a smooth bell-shaped curve, the market has a natural spread of prices with most in the middle
- If you see multiple peaks, there might be different versions or conditions of the bag at different price points
- If the points are spread out evenly, the market doesn’t have a clear consensus on pricing yet
Comparable Listings Options
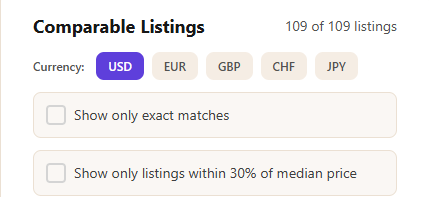
☑️ Show only exact matches
When this box is checked, you’ll only see bags with the exact same model name as the one you searched for. This gives you the most precise comparison.
When you uncheck this box, you’ll see all listings that came up from the search. Some websites have search engines that aren’t as precise, so you might see similar bags that aren’t exactly the same model. This can be useful to see related styles and their pricing, but remember that not every listing will be a perfect match.
Note: We don’t control which listings appear when unchecked—that depends on each website’s own search engine.
☑️ Show only listings within 30% of median price
This is another way to filter out the extremes and focus on the most typical listings. When checked, you’ll only see bags priced within 30% above or below the median price.
Use this when you want a clearer view of the mainstream market, without unusually high or low prices cluttering your view.
Questions about your report? Contact our team for assistance!